
Cities, first_page
India Data Center Market: Comprehensive Analysis and Investment Outlook (Part 1)
Industry Expert & Contributor
26 Jan 2026

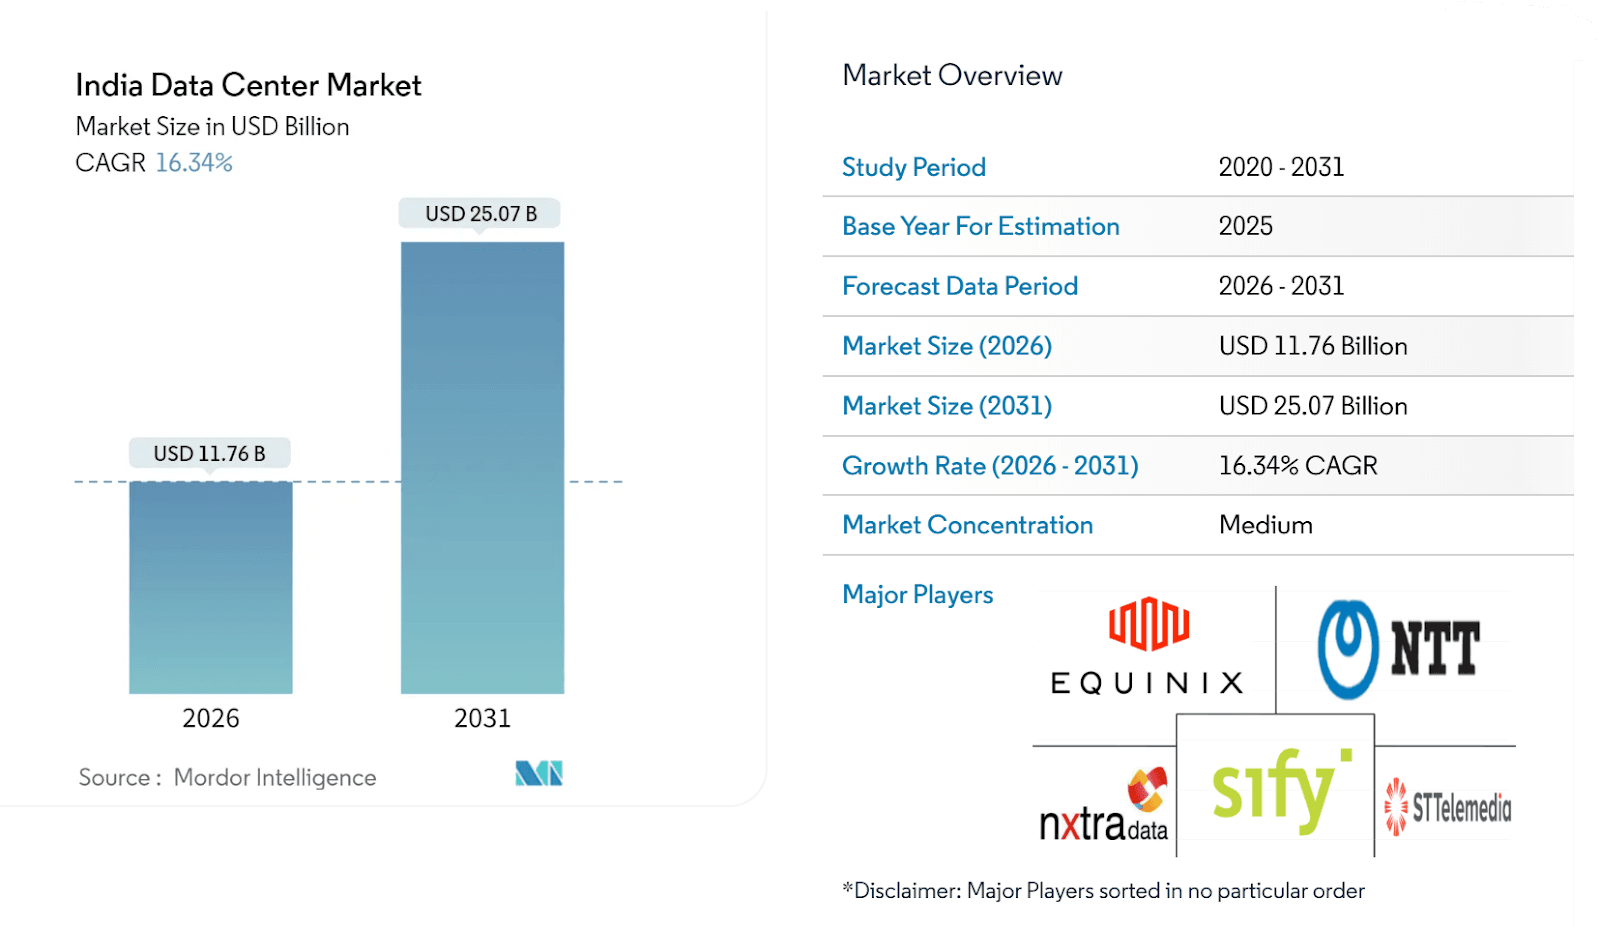
India's data center market is approaching a pivotal inflection point in 2026. With a valuation of USD 11.76 billion and operational capacity ranging from 1.7 to 2 gigawatts, the sector is undergoing rapid expansion driven by regulatory mandates, digital transformation, and significant capital inflows.
A significant driver is the disparity between data generation and storage: India produces 20% of global data but stores only 3% locally. This imbalance, together with new data localisation regulations and rapid growth in AI workloads, is generating sustained demand that exceeds current supply. By 2031, the market is forecasted to reach USD 25.07 billion, reflecting a compound annual growth rate of 16.34%.
Market Trajectory and Scale
Recent data highlight a pivotal inflection point in India's data center market. Industry estimates show expansion from USD 10.1 billion in 2025 to approximately USD 11.7–11.8 billion in 2026, representing around 16% year-on-year growth as hyperscale cloud demand, data localisation, and AI workloads converge.
Operational capacity reached approximately 1.5–1.6 GW in 2025, following the addition of nearly 380–400 MW of new capacity, marking the largest annual commissioning in India to date. For 2026, most real estate and advisory firms forecast an additional 200–250 MW of capacity, bringing total installed capacity to the 1.85-2.0 GW range.
The most significant transformation is anticipated during the 2026–2030 period. Projections indicate that India could achieve multi-gigawatt capacity by the end of the decade, with upper-range scenarios nearing 8–9 GW, subject to power availability and execution speed. This level of expansion would require USD 25–30 billion in cumulative infrastructure investment, positioning data centers among the most capital-intensive infrastructure asset classes in India.
Growth is not limited to volume alone. IT load capacity is projected to increase from approximately 4.5 GW in 2025 to over 12 GW by 2030, implying a compound annual growth rate exceeding 20%. This increase is driven by AI-led enhancements in rack density, GPU deployment, and high-performance computing workloads.
The scale and pace of this build-out are often compared to India's telecom infrastructure expansion in the early 2000s, but with substantially higher capital intensity. Each megawatt of data center capacity now requires INR 60–70 crore (approximately USD 7–8 million), including land, electrical infrastructure, cooling, and specialised systems.
Related Contents:
Key Statistics & Projections
- Installed Capacity is projected to reach approximately 1.7 to 2.0 GW by the end of 2026, with an estimated 220 MW of new capacity. This growth reflects sustained demand from hyperscale and enterprise segments.
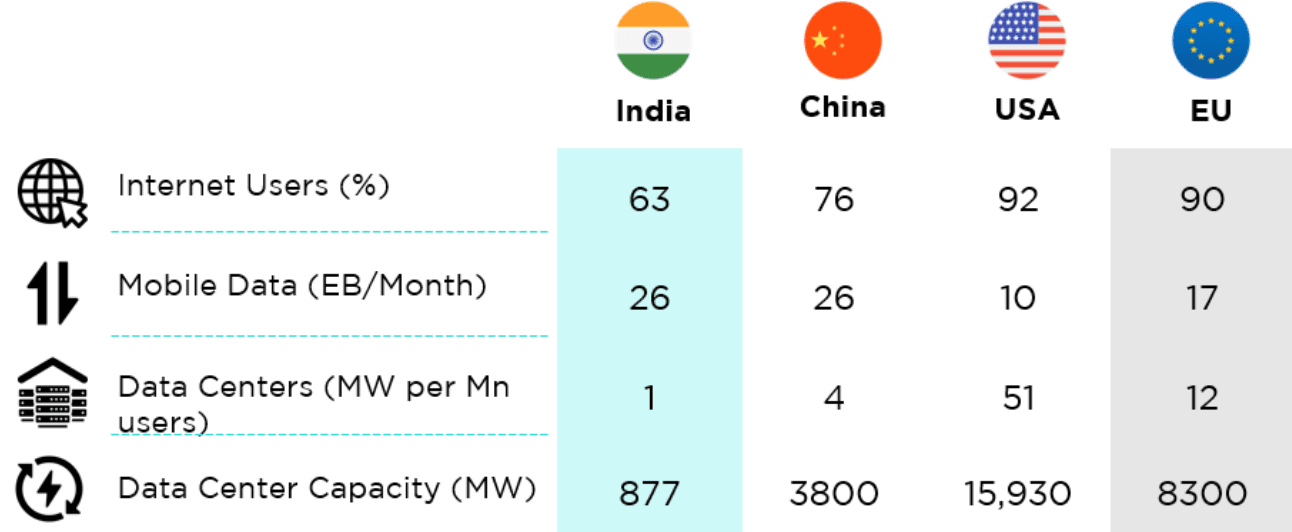
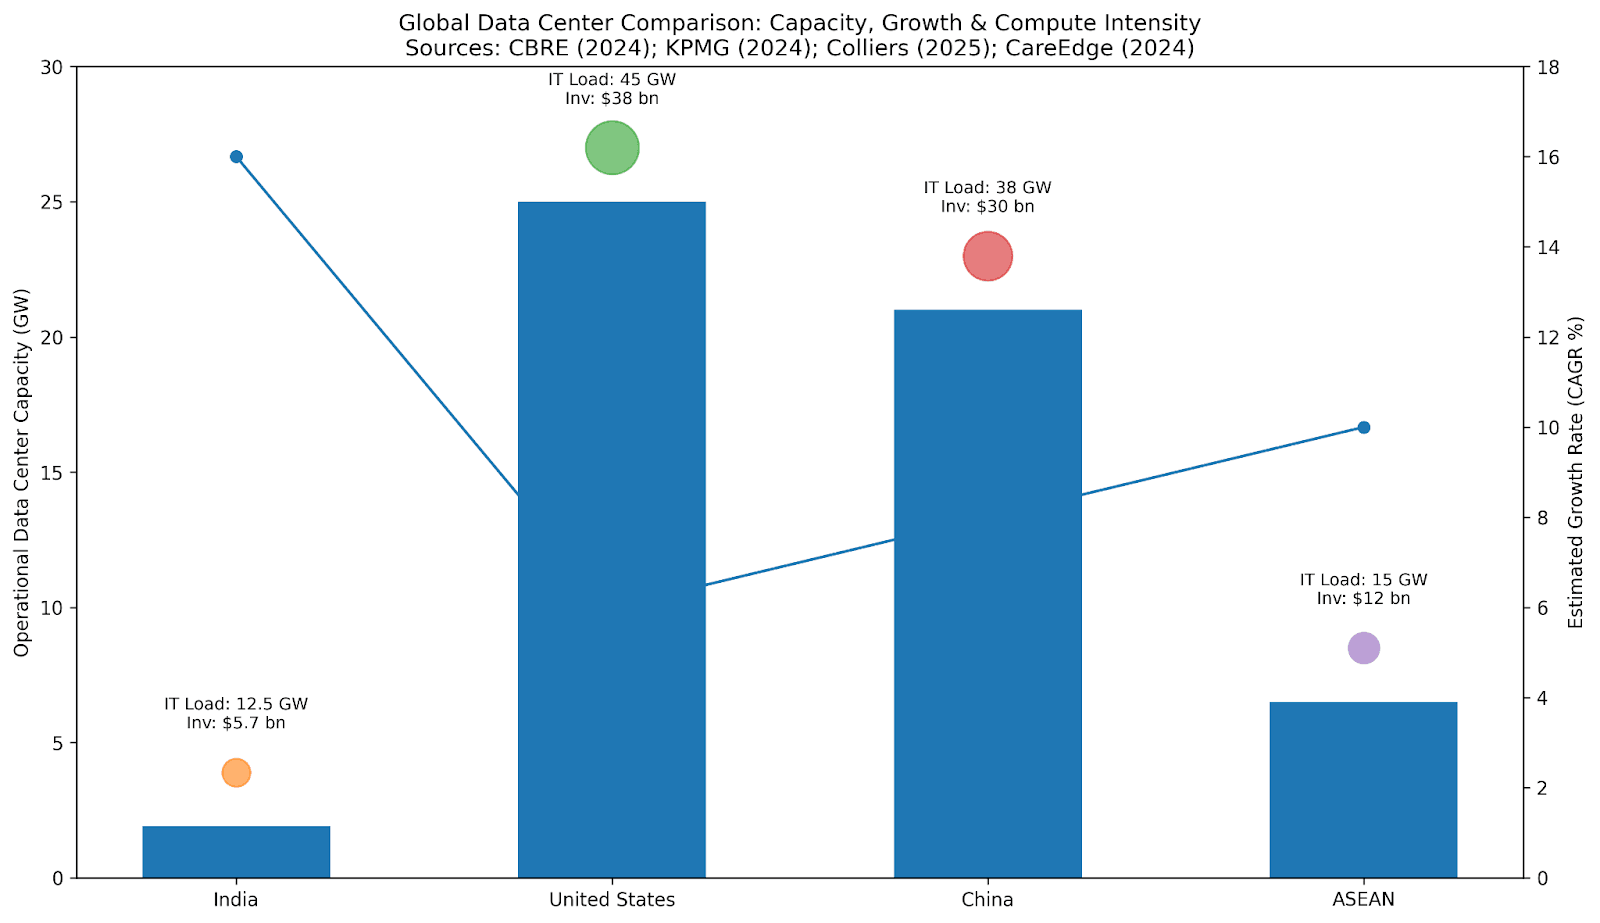
- Global Capacity Benchmarks: India remains significantly under-scaled compared to the United States (over 25 GW), China (approximately 20 to 22 GW), and ASEAN countries (approximately 6 to 7 GW). This disparity highlights substantial potential for long-term expansion.
- Market Value is estimated at USD 11.76 billion in 2026 and is projected to reach USD 25.07 billion by 2031. This trajectory implies a compound annual growth rate of approximately 16-17 percent, ranking among the highest globally for the sector.
- Real Estate and Infrastructure Investment demand is expected to exceed USD 5.7 billion by 2026, which remains materially lower than the annual data center capital expenditure in the United States (USD 35 to 40 billion annually).
- IT Load Capacity is projected to increase from approximately 4.48 GW in 2025 to approximately 12.47 GW by 2030, representing a compound annual growth rate exceeding 20 percent. This growth is driven by artificial intelligence, increased GPU density, and high-performance computing workloads.
- Data Center Power Load increased to approximately 1,400 MW in 2024, with projections indicating it will reach approximately 1,825 MW by 2026.
- Structural Insight: Compared to the United States and China, India's growth is led by compute intensity rather than physical footprint. This trend indicates a structural shift toward AI-driven demand instead of traditional colocation expansion.
Major Growth Drivers
- Digital India & AI Adoption: Government-led digitalisation initiatives and incentives are driving demand for hyperscale cloud and AI-related data centers.
- Data Localisation Mandates: Regulatory requirements, such as those mandated by the DPDP Act and the Reserve Bank of India (RBI), are generating compulsory demand for domestic data storage and processing.
- OTT & Edge Computing: The proliferation of streaming, gaming, and real-time services is accelerating the growth of edge data centers in Tier-2 cities to reduce latency.
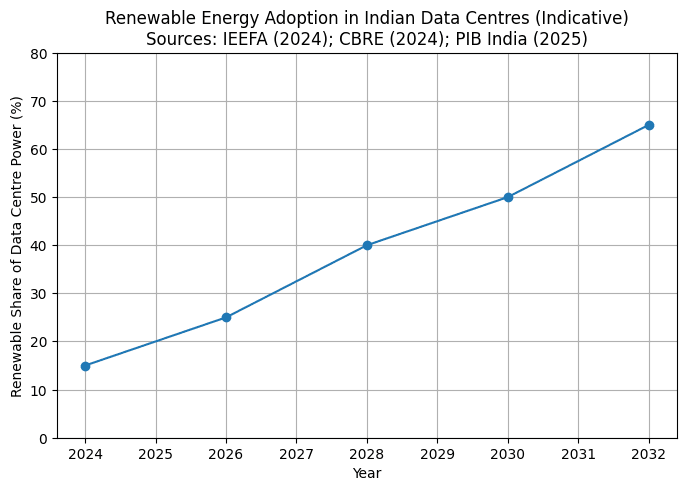
- Renewable Integration: Partnerships between data center operators and energy providers are expediting the transition to sustainable, renewable-powered data centers.
Key Market Trends
- Supply–Demand Gap: The expansion of data center capacity is not keeping pace with India's data generation, thereby undermining medium-term growth prospects.
- Market Diversification: The entry of new market participants is intensifying competition and diminishing the dominance of incumbent firms.
- High-Density Design: The increasing prevalence of AI workloads is driving the adoption of racks exceeding 50 kW and the implementation of advanced cooling solutions, including liquid and hybrid systems.
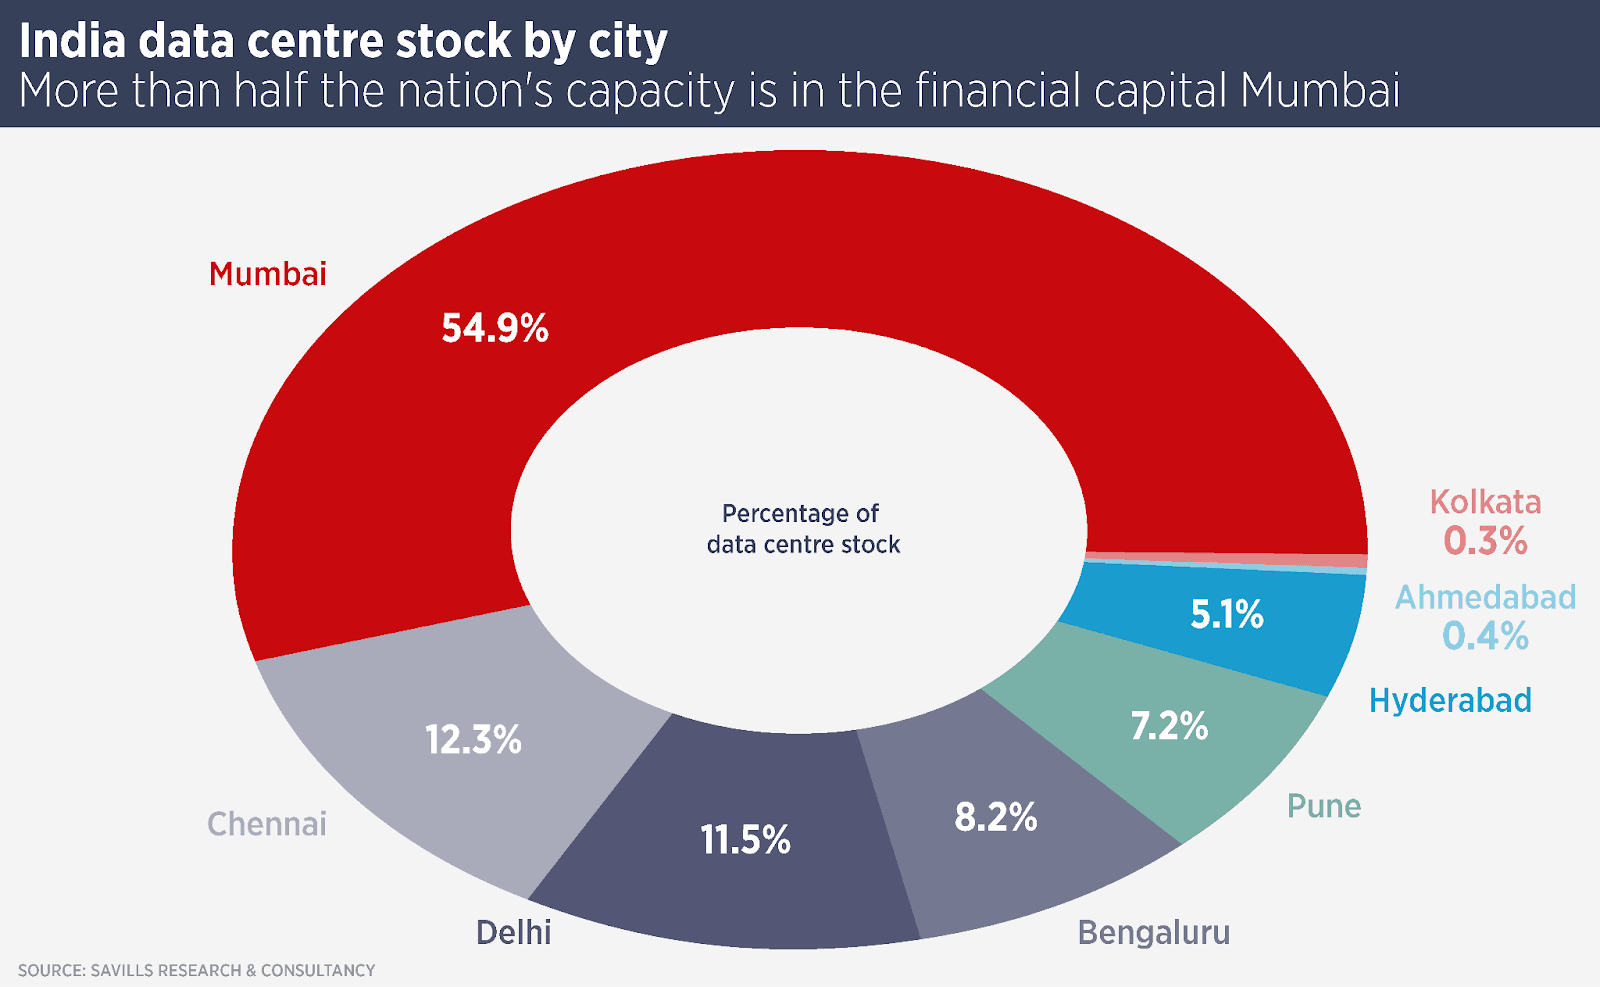
- Geographic Hubs: Mumbai, Hyderabad, Chennai, and Pune continue to be preferred locations due to superior connectivity and reliable power infrastructure.
State-wise Data Centre Initiatives, Policies & Incentives
| State | Key Incentives | Target / Indicative Capacity | Unique Feature / Strategic Advantage |
|---|---|---|---|
| Andhra Pradesh | Land allotment at concessional rates, capital & fiscal incentives, single-window clearances | 200+ MW (announced) | Data Centre Policy 4.0 with focus on integrated DC parks and long-term power availability |
| Maharashtra | Capital subsidies, stamp duty & electricity duty exemptions | Highest installed & pipeline capacity | India's most established DC hub (Mumbai–Navi Mumbai) with dense subsea cable landings |
| Telangana | Progressive DC policy, power tariff incentives, fast-track approvals | Rapidly expanding | Strong technology ecosystem; Hyderabad emerging as a hyperscale-friendly alternative |
| Tamil Nadu | Ease-of-doing-business reforms, infrastructure support | Expanding pipeline | Coastal location with multiple cable landing stations; strong industrial base |
| Gujarat | Concessional land, power tariff support, renewable energy access | Developing | Renewable-energy-driven DC strategy; policy focus on green data centres |
| Rajasthan | Land and power concessions, tax incentives, capital subsidy | Early-stage | High solar potential; positioning as a sustainable and cost-efficient DC destination |
| Uttar Pradesh | Land subsidies, capital incentives, electricity duty exemptions | Large pipeline (Noida–Greater Noida) | Proximity to NCR; promotion of hyperscale and AI-focused campuses |
| Karnataka | Infrastructure incentives, policy support for DC parks | Growing | Bengaluru's cloud, SaaS, and enterprise demand anchor DC growth |
| West Bengal | Capital subsidies, power tariff support, policy-driven facilitation | Emerging | Strategic gateway to eastern India and ASEAN connectivity |
| Madhya Pradesh | Land incentives, renewable power access | Early-stage | Central location with low land cost and sustainability positioning |
Research Insight: State-level policies are increasingly significant in determining capacity allocation decisions. Although Maharashtra and Tamil Nadu currently lead in near-term supply, Andhra Pradesh, Telangana, Uttar Pradesh, Gujarat, and Rajasthan are emerging as prominent destinations due to lower land costs, improved access to renewable energy, and accelerated policy-driven execution.
Tier Classification and Reliability Standards
Tier III facilities remain the baseline industry standard in India, offering a balance of availability, redundancy, and cost efficiency. In contrast, the adoption of Tier IV facilities is increasing, especially in regulated and mission-critical sectors, driven by more stringent uptime requirements, data localisation mandates, and the sensitivity of AI-driven workloads.
| Tier Classification | Availability (Uptime Institute Standard) | Redundancy Architecture | Growth Trend / CAGR | Primary Users / Workloads |
|---|---|---|---|---|
| Tier I–II | ≤99.741% (Tier I) / 99.749% (Tier II) | N (single path) | Declining | Development & testing environments, non-critical workloads, cost-sensitive SMEs |
| Tier III | 99.982% | N+1 (concurrently maintainable) | Dominant market standard | Large enterprises, cloud service providers, telecom, e-commerce |
| Tier IV | 99.995% | 2N or 2N+1 (fault tolerant) | ~20–22% CAGR | BFSI, healthcare, government, mission-critical AI and real-time applications |


